When trying to educate potential customers about a relatively new field, technology or animal model, biotech companies often use the following sentence in their websites, marketing emails or social media posts:
“XXX is gaining popularity among researchers”
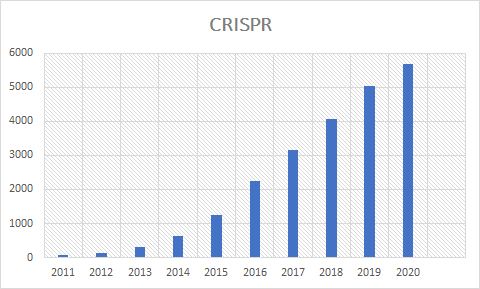
However, they often don’t show any numbers or figures to support the claim. The audience, typically researchers, would be more intrigued if you show them a graph of the publication trend from an unbiased source, like the following:
How to do that? We created a tool to make it easy for you to find the trend of publications of any keyword from PubMed.
First, go to https://www.biz-genius.com/tools/publication-trend/
Then enter your keyword. You may use AND to combine terms.
Then select Year-by-year, Month-by-month, or Day-by-day. Our tool can count the number of publications in the past few years, months, or days.
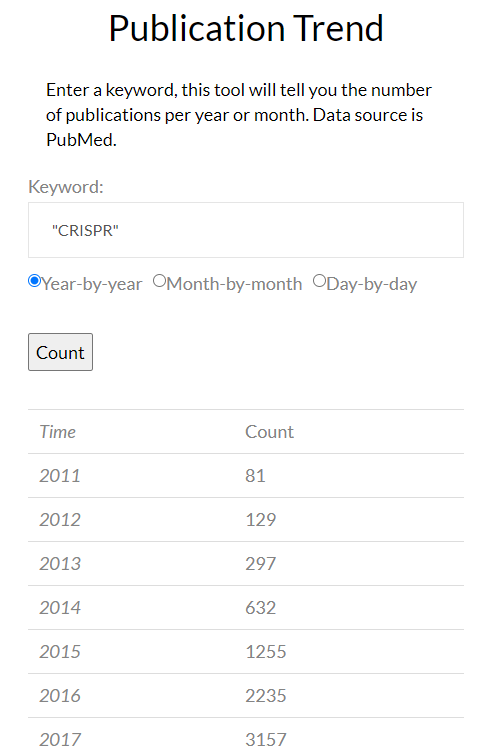
Click button “Count”. After a few seconds, the publication numbers will be shown in the result. The screenshot below shows an example with keyword CRISPR.
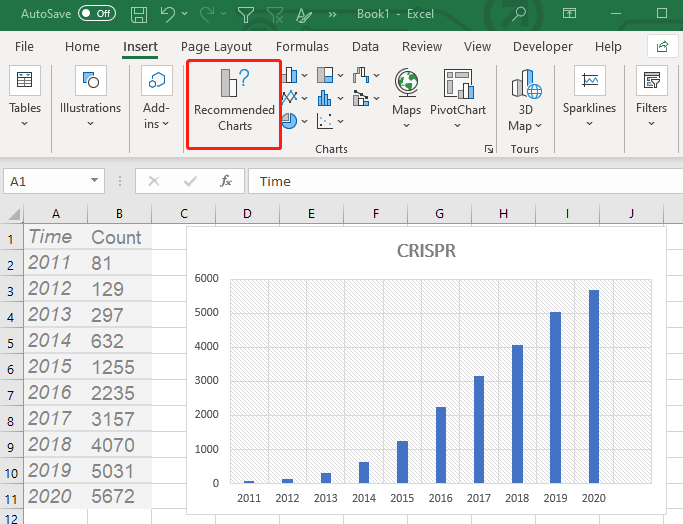
Then you can copy the table to Excel, and click “Recommended Charts”. Wah lah – you get a publication trend graph in a minute!