

Some clients asked us if it is possible to change the colors of the markers and clusters in the citation map. We recently updated our Smart Embed Code to make it flexible to change the styles. This way you can make the map more natively looking.
1. Enable or disable clustering
Clustering of adjacent markers are enabled by default. But you can disable this behavior by setting:
data-disable-cluster="1"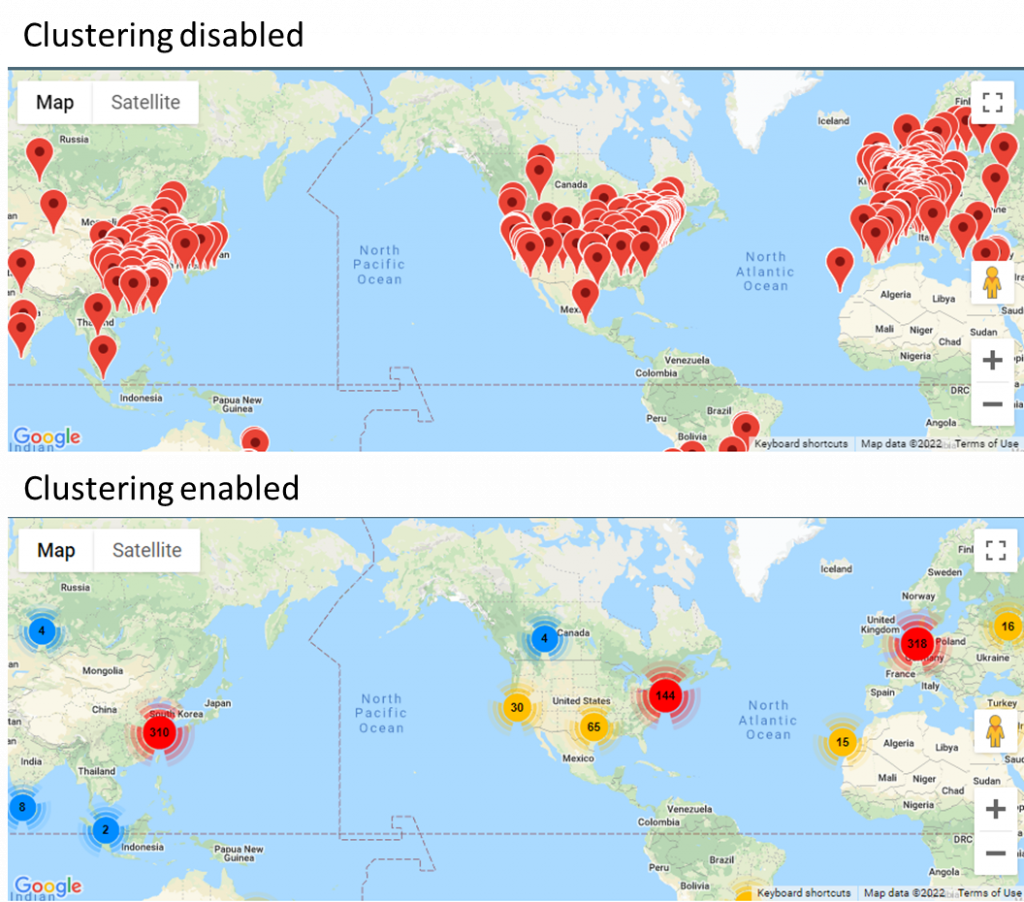
2. Change the icon of the markers
The default icon of a single marker is a red bubble. You may change the icon of the individual markers by setting:
data-custom-icon="https://maps.google.com/mapfiles/ms/icons/green-dot.png"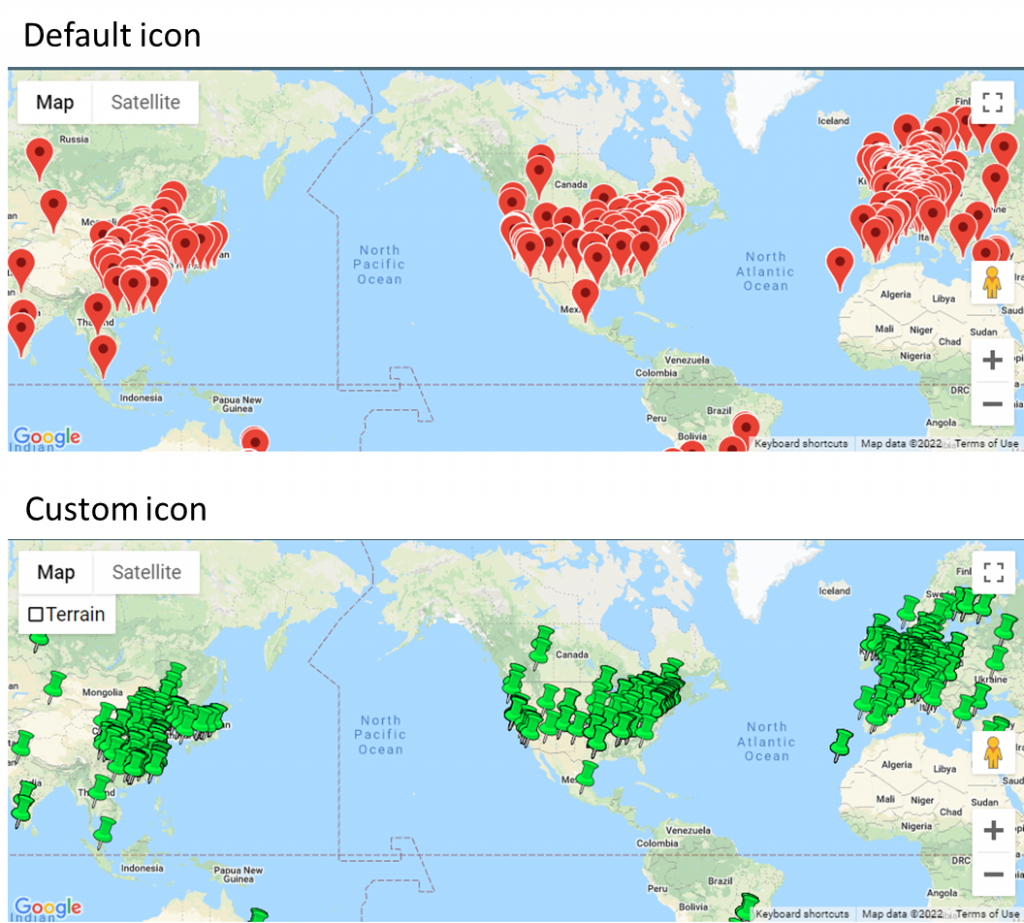
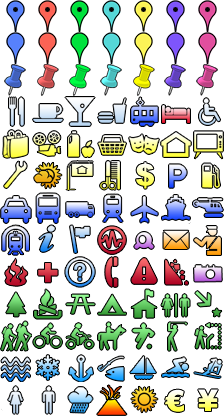
You may use your own icon, or choose one from hundreds of Google’s predefined icons. If you use your own icon, be sure to make the background transparent.
3. Change the cluster colors
You may change the color of the clusters by setting:
data-cluster-colors="ffee00++fbb806++f6830c++f24d11++ed1717"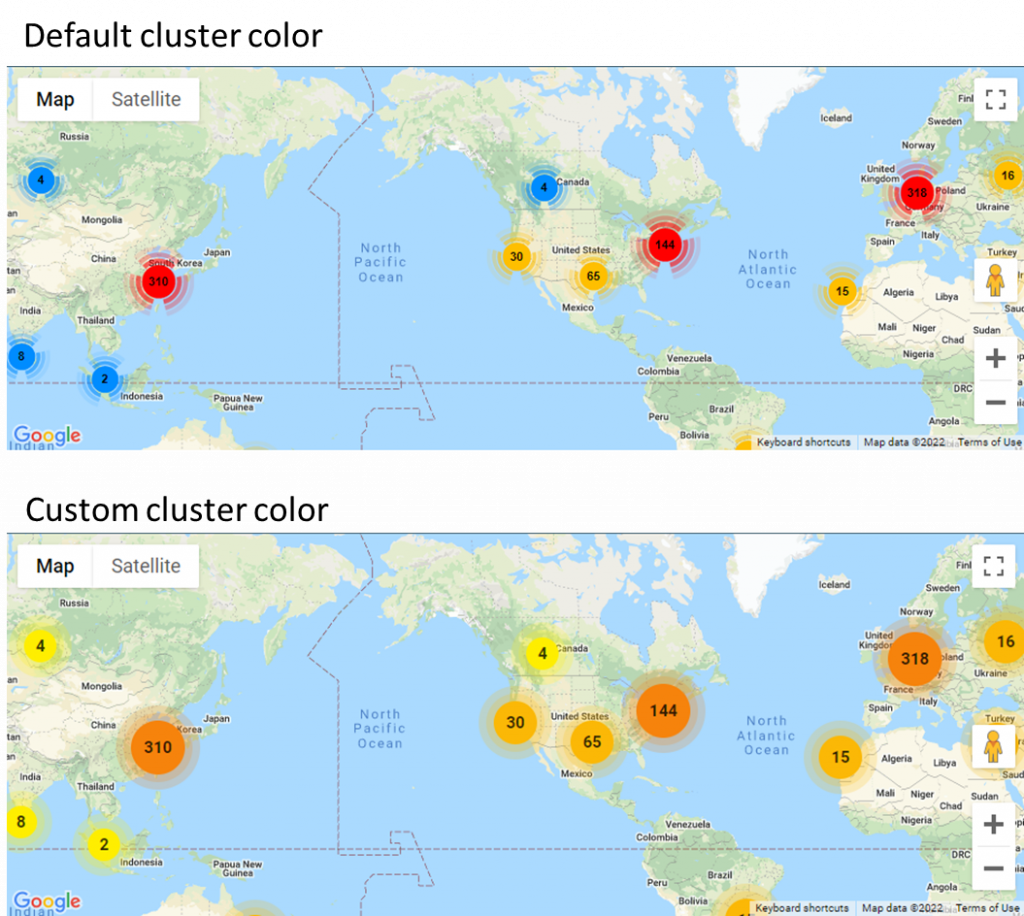
You need to enter 5 colors in Hex code (without the # symbol) for clusters from small to big, separated by ++. The colors also support transparency. For example, FF000080 is red but with 50% transparency. You may use Adobe’s color tool to pick up best looking color combinations.
In summary, the 3 options mentioned above allows you to customize your map’s look in endless ways. You can combine them to create a unique map style that suits your needs. Please note these options only work for citation map version 2.
If you want to create a citation map for your website or internal use, please feel free to contact us.