We have 40 years of NIH funding data (updated monthly). It can certainly be used to generate leads as some of our customers do, but the data also provide some interesting facts of the history of biomedical research funding in the United States.
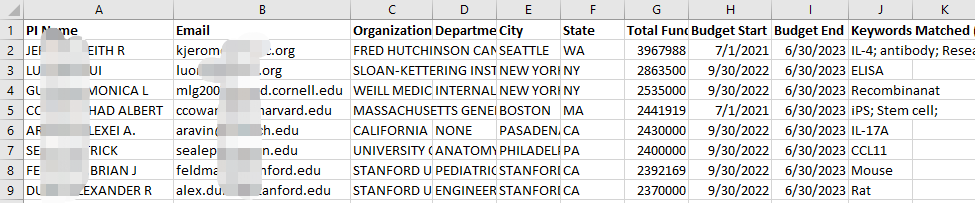
Graph 1: The number of funded projects in the past 40 years.
This graph reveals some interesting findings:
- 6,000 new grants are awarded each month.
- There was a surge of NIH funded projects in 1996-1998 Clinton era.
- The number of funded projects increased in 2009 amidst the financial crisis, thanks to the American Recovery and Reinvestment Act. I remember vividly that our lab at Stanford wrote a lot of grant applications that year!
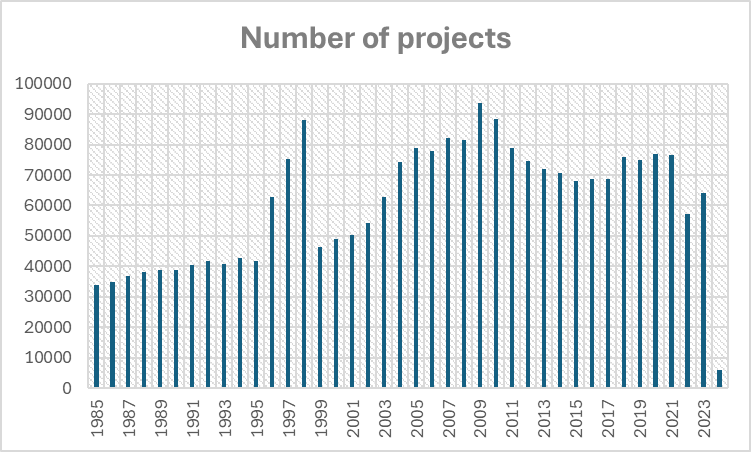
Graph 2: The total funding amount in the past 20 years.
- The total amount of NIH funding is about $30B/year.
- The surge in 2009 is still due to the American Recovery and Reinvestment Act.
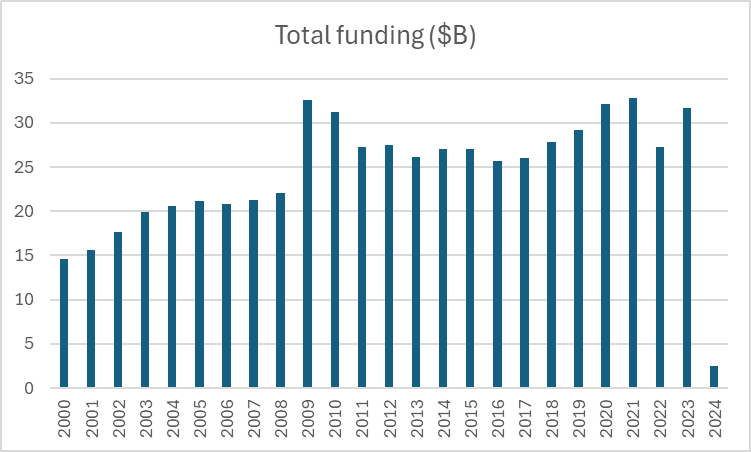
Graph 3: Funding amount per project in the past 20 years.
- The funding for each project averages around half a million dollars.
Graph 4: The number of project in each month
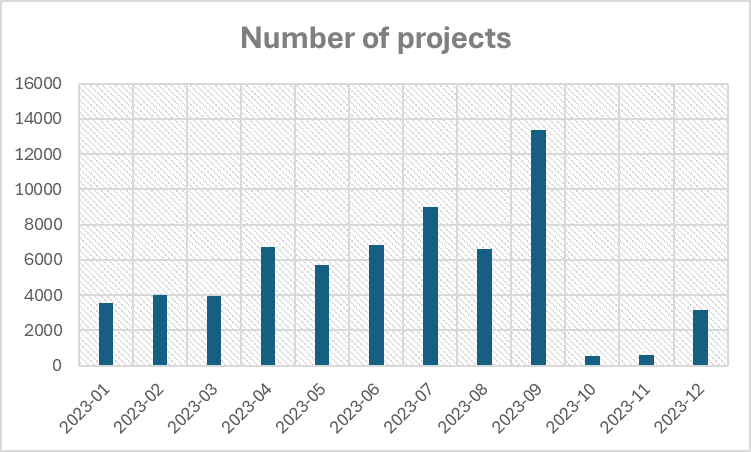
- Most projects were funded during summer time. The graph above shows the number of projects from month to month for the year of 2023.
To be continued …
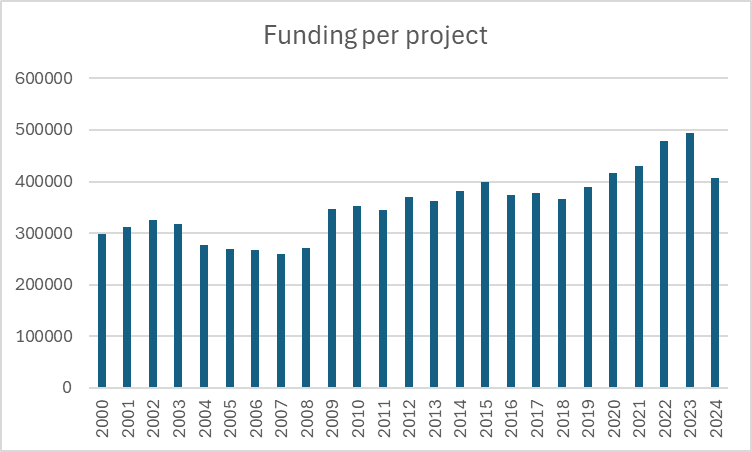
We can help you compile a list of grant holders, including their email addresses, in an Excel format (screenshot below). This will make it easy for you to import them into your email marketing program and contact them. You may use this free tool to estimate the number.