
Citation Smart Embed Code
BizGenius' Smart Embed Code allows you to display your citations professionally on your website without coding. Each visual component is only one line of code, and you only need to add to your webpage once, and the content will update itself automatically when we update the backend data. Smart Embed Code will save you a ton of time and hassle.
Key benefits
Case studies
“BizGenius has been an integral part of our marketing strategy at OriGene for the past 12 years. Their citation tracking service consistently delivers accurate, high-value data that helps us make informed decisions. We also rely on BizGenius’s citation widget to showcase our product citations in a clean, professional format on our website. Their customer support is truly outstanding - responsive, knowledgeable, and always eager to help. Although I seldom write testimonials, I’m genuinely pleased to endorse BizGenius and their exceptional services.

“Tracking citations, maintaining our own database, and updating the website became labor intensive with multiple people required to execute. BizGenius freed up our team to work on other projects once citation tracking became automatic. Xu and Valerie worked with us to fine tune our search terminology, and we used the widget playground to create a display that was exactly as we wanted. It was less than 3 weeks from the time we started the project to full deployment on our site. With the Citation Tracker, a multi-step, multi-person task became completely touchless.


“I couldn’t be more thrilled with my experience using BizGenius! Integrating the citation tool onto our website was seamless, and the results are outstanding. The added citations have significantly boosted the credibility of our products. In addition, the customer support team is incredibly responsive and consistently goes above and beyond to help with any questions. I highly recommend BizGenius to any business aiming to enhance their website’s effectiveness.

Visual components
Citation Number
To show a summary of how many publications have cited you, you may use Citation Number widget. For example:
Total Number of Publications
Publications This Year
Publications Last Month
The above citation number is generated from this line of code:
<div id="bizgenius-citation-widget-container-count-total-year-month" style="display:flex; justify-content:center; flex-wrap:wrap;"></div>
You may further customize the widget. For example, you may show the three numbers individually, and you can also change the font size and family.
Total Number of Publications
Publications This Year
Publications Last Month
<div style="font-size:12px;  display:flex; justify-content:center; flex-wrap:wrap;">
    <div id="bizgenius-citation-widget-container-count-total" style="font-size:12px; width:300px;"></div>
    <div id="bizgenius-citation-widget-container-count-year" style="font-size:12px; color:rgb(0, 4, 255); width:300px;"></div>
    <div id="bizgenius-citation-widget-container-count-month" style="font-size:12px; width:300px; color:lightseagreen"></div>
</div>
Total Number of Publications, Publications This Year, and Publications Last Month. You may change the labels by modifying the data-label parameter. Use ++ to separate 3 labels for the bizgenius-citation-widget-container-count-total-year-month component. For example,
<div id="bizgenius-citation-widget-container-count-total-year-month" data-label="Total++Past 12 Months++Last Month" style="color:black; display:flex; justify-content:center; flex-wrap:wrap;"></div>
Please note, you can't use both bizgenius-citation-widget-container-count-total-year-month and individual number components such as bizgenius-citation-widget-container-count-total at the same time in a page.
Interactive Citation Map
Interactive map allows your potential customers intuitively see how popular your products are.
The above map is generated from this line of code:
<div id="bizgenius-citation-widget-container-map" style="width:100%;height:400px"></div>
This widget supports the following parameters to make it flexible for your own style:
data-disable-cluster="0" // if set to 1, then clustering of adjacent markers will be disabled. The default value is 0

data-cluster-colors="ffee00++fbb806++f6830c++f24d11++ed1717" // the colors of clusters from small to big. This parameter works only when clustering is enabled

data-custom-icon="https://maps.google.com/mapfiles/ms/icons/green-dot.png" // the icon of individual markers

data-paper-link="stork" //the default site for a paper's abstract and full text information when a user clicks a paper. Default "stork", can also be "pubmed" or "journal".
The data-disable-cluster parameter allows you to disable the clustering of adjacent markers and show individual markers. The data-cluster-colors parameter allows you to change the color of the clusters. You need to enter 5 colors in Hex code (without the # symbol) for clusters from small to big, separated by ++. The colors also support transparency. For example, FF000080 is red but with 50% transparency. You may use Adobe's color tool to pick up best looking color combinations. The data-custom-icon parameter allows you to change the icon of the individual markers. The default is a red icon. You may use your own icon, or choose one from hundreds of Google's predefined icons. If you use your own icon, be sure to make the background transparent.
Interactive Citation Map (3D)
Interactive map allows your potential customers intuitively see how popular your products are.
The above map is generated from this line of code:
<div id="bizgenius-citation-widget-container-map-3d" style="width:100%;height:400px"></div>
This widget supports the following parameters to make it flexible for your own style:
data-paper-link="stork" //the default site for a paper's abstract and full text information when a user clicks a paper. Default "stork", can also be "pubmed" or "journal".Citation Figure Slider
Citation figure slider adds a dynamic and engaging element to your website, making it easier for your website visitors to perceive your impact.
Fig. 2. Source reconstruction methods, results and ventral model specification.a, The main steps of source reconstruction: cortical mesh creation, projection on structural template, co-registration of EEG signal to the template and maximum intensity projection (MIP) for each participant, allowing us to…
From Miriam Vignando et al. (2026), Nature. Mental health: Deviations in effective connectivity explain different hallucination subtypes in Parkinson's disease psychosis · view figure
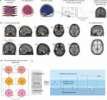
Figure 1. Gray matter associations with TMT-B&W-A and TMT-B&W-B performance across the base and fully adjusted models. Abbreviations: TMT-B&W-A = Trail-Making Test-Black And White Part A; TMT-B&W-B = Trail-Making Test-Black And White Part B; Base model = unadjusted; Full model = adjusted education, gender,…
From Chanda Simfukwe et al. (2025), Journal of clinical medicine: Associations Between Trail-Making Test Black and White Performance and Gray Matter Volume in Community-Dwelling Cognitively Healthy Adults Aged 40 to 80 Years · view figure
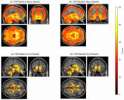
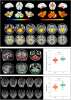
Fig. 2. Brain volume(s) and spinal cord area in patients with spinocerebellar ataxia type 3 (SCA3). a Voxel-based morphometry analysis showed brain volume differences in grey matter (GM, upper left), white matter (WM, upper right) and GM and WM overlaps (bottom) between SCA3 patients and healthy controls…
From Zhi-Xian Ye et al. (2025), Orphanet journal of rare diseases: Associations between CAG repeat size, brain and spinal cord volume loss, and motor symptoms in spinocerebellar ataxia type 3: a cohort study · view figure
Fig. 3. Brain volume(s) and spinal cord area(s) in patients with different stages of spinocerebellar ataxias type 3 (SCA3). a Voxel-based morphometry analysis showed grey matter (red) and white matter (yellow) volume differences in patients with presymptomatic SCA3, disease duration < 10 years, and disease…
From Zhi-Xian Ye et al. (2025), Orphanet journal of rare diseases: Associations between CAG repeat size, brain and spinal cord volume loss, and motor symptoms in spinocerebellar ataxia type 3: a cohort study · view figure
Figure 3. β maps and LI values in the planning block. (a–c) β maps of participants with LI values close to the median in younger, expert older, and non-expert older groups are shown, respectively. (d) Distribution of LI values for the three participant groups. * p < 0.016. β maps were visualized using the…
From Koki Toyofuku et al. (2024), Healthcare (Basel, Switzerland): Hemispheric Lateralization in Older Adults Who Habitually Play Darts: A Cross-Sectional Study Using Functional Near-Infrared Spectroscopy · view figure
Figure 4. β maps and LI values in the calculation block. (a–c) β maps of participants with LI values close to the median in the younger, expert older, and non-expert older groups are shown, respectively. (d) Distribution of LI values for the three participant groups. β maps were visualized using the xjView…
From Koki Toyofuku et al. (2024), Healthcare (Basel, Switzerland): Hemispheric Lateralization in Older Adults Who Habitually Play Darts: A Cross-Sectional Study Using Functional Near-Infrared Spectroscopy · view figure
Figure 2. . Region of interest analyses. (A) ROI mask for right dorsolateral prefrontal cortex (R-DLPFC) [58 26 38]. A 10 mm sphere was created using the MarsBar toolbox (Brett et al., 2002) and the xjView toolbox (https://www.alivelearn.net/xjview). The image was then projected onto the template using…
From Eric S Jackson et al. (2022), Neurobiology of language (Cambridge, Mass.): Activation in Right Dorsolateral Prefrontal Cortex Underlies Stuttering Anticipation · view figure
FIGURE 2. Increased neural response to RMET minus control condition contrasting NSSI and control groups. The whole-brain analysis indicated increased activation during RMET in (A) the left medial superior frontal gyrus in the NSSI group (−10, 32, 36; Z = 3.98) and (B) the right angular gyrus in the control…
From Hyeri Moon et al. (2022), Frontiers in psychiatry: Neural correlates of affective theory of mind in medication-free nonsuicidal self-injury: An fMRI study · view figure
Figure 4. Source map of N1 (time window: 70~200 ms) to the target stimuli under Erotica in healthy volunteers (A), bipolar I disorder patients with (B) and without (C) hypersexuality (generated by xjView 10.0 (http://www.alivelearn.net/xjview (accessed on 18 February 2022)). Left panels show sources overlaid…
From Chu Wang et al. (2022), Brain sciences: Visual Event-Related Potentials under External Emotional Stimuli in Bipolar I Disorder with and without Hypersexuality · view figure
Figure 7. Whole-brain analysis results of regional differences between HS patients and HC. (A) Horizontal images made by xjView based on the result of VBM. (B) Three-dimensional images made by BrainNet Viewer based on the result of VBM.
From Senlin Chen et al. (2022), Frontiers in aging neuroscience: Degeneration of the Sensorimotor Tract in Degenerative Cervical Myelopathy and Compensatory Structural Changes in the Brain · view figure
The above figure list is generated from this line of code:
<div id="bizgenius-citation-widget-container-list-figure" data-product-name="xjview" data-hide-0="yes" style="width:100%;height:400px"></div>
data-product-name="RNA++DNA" // the product name(s). You can specify multiple names separated by ++. If empty, all figures will be listed

data-hide-0="yes" // if there is no figures, hide the element? Default is "no"
Citation List
Citation List widget allows you to show a list of citations. It can be a complete list in your main page, or you may show one list in each of your product page.
Vignando, Ffytche, Mazibuko et al
Nat Ment Health (2026) 4 (6), 994-1009 DOI: 10.1038/s44220-026-00669-7
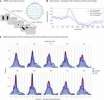
Vignando, Ffytche, Mazibuko et al
Nat Ment Health (2026) 4 (6), 994-1009 DOI: 10.1038/s44220-026-00669-7
Simfukwe, An, Youn
J Clin Med (2025) 14 (12) DOI: 10.3390/jcm14124041
Simfukwe, An, Youn
J Clin Med (2025) 14 (12) DOI: 10.3390/jcm14124041
Ye, Chen, Li et al
Orphanet J Rare Dis (2025) 20 (1), 35 DOI: 10.1186/s13023-025-03531-8
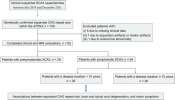
Ye, Chen, Li et al
Orphanet J Rare Dis (2025) 20 (1), 35 DOI: 10.1186/s13023-025-03531-8
The above list is generated from this line of code:
<div id="bizgenius-citation-widget-container-list" data-theme="icon-2" data-product-name='DNA' data-order="publicationDate" data-maxnum="6" data-show-abstract="yes" data-show-figure="2" data-show-snippet="yes" style="width:100%;"></div>
This widget supports the following parameters to make it flexible for your purpose. For example:
data-theme="icon-2" //use predefined themes. Default is icon-2. See below of available options

data-show-snippet="yes" //"yes" or "no", default "yes". Show snippet or not

data-show-figure="3" // an integer number, indicating the maximum number of figures you want to show for each citation (only for open access papers. Default 3)

data-show-abstract="no" //"yes" or "no", default "no". Show abstract or not

data-product-name="DNA" // show citations of a single product. Default empty

data-product-name="DNA++RNA++Protein" // show citations of multiple products, separated by ++. Default empty

data-order="impactFactor" // can also be publicationDate or cited

data-maxnum="12" // number of citations per page

data-showoriginalkeyword="no" // "yes" or "no", default "no". Show the original search keyword

data-highlightjournal="no" // "yes" or "no", default "no". Highlight journal (with yellow) based on its reputation

data-show-doi="yes" //"yes" or "no", default "yes". Show paper DOI if available

data-show-paging="yes" //"yes" or "no", default "yes". Show the text "Showing 1-x of y papers"

data-keyword-highlight="cell,RNA" //keywords to be highlighted in the abstract or snippet. Use comma to separate multiple keywords.

data-paging="append" // "append" or "replace", default "append". If "append", new papers will be shown after the previous ones; if "replace", new papers will replace previous ones.

data-search-keyword='"lung cancer"' // a string to search for publications

data-paper-link="inpage" //the default site for a paper's abstract and full text information when a user clicks a paper. Default "inpage", can also be "stork", "pubmed" or "journal". "inpage" means the paper detail will be displayed in the popup window in the same page.

data-no-paper-message="No papers found." //the message displayed when there is no paper found (this option only works for citation list of a product)

data-hide-0="no" //"yes" or "no", default "no". Whether to hide the entire div if there is no citations to display

data-show-export"="no" //"yes" or "no", default "no". Whether to show the "export" button. When a user clicks the button, he can download the citations in the current page

data-show-share="yes" //"yes" or "no", default "yes". Whether to show the "Share" button. When a user clicks the button, the url of the search result will be copied to the clipboard

data-show-cited="yes" //"yes" or "no", default "yes". Whether to show the "Cited" information. The "Cited" information is the number of times a paper has been cited by other papers.

data-show-aisummary="yes" //"yes" or "no", default "yes". Whether to show the AI Summary (if available)

data-show-tags="yes" //"yes" or "no", default "yes". Whether to show the tags (if available)
The default values of the parameters are empty. When data-product-name is specified, only the citations of that product(s) are shown. data-order takes the following possible values, impactFactor, publicationDate, cited, or id. If empty, the list is shown in chronological order (most recent top). If impactFactor, then high impact papers are shown first. data-maxnum specifies the number of citations to show. To increase loading speed, it is better to show a smaller number (say 6 or 12). data-showoriginalkeyword specifies if you want to show the original keyword used to find this citation. It takes 1 or 0. data-highlightjournal specifies if you want to show the yellow highlight of the journals based on their reputation. A value no means do not show the highlight. By default the highlight is shown. data-show-abstract="yes" will show the abstract. Note the list has a "More" button allowing the users to load more citations. Depending on the value of data-paging, the new citations will either append or replace the previous citations.
Citation Search Box and Filter
Citation Search Form widget allows you and your customers to search your citations. It usually couples with a Citation List widget to show the search result. Please click the button below to view a live example.
The form/list is generated from this line of code:
<div id="bizgenius-citation-widget-container-form" data-product-list="RNA++DNA++Protein" data-filter-impact="yes" data-classes="- Any Application - ||Neuroscience||Cancer++- Any Species - ||Rat||Mouse||Pig++- Any Year - ||2020||2019||1990-2020++- Any Country - ||United States||Germany||China" style="width:100%;padding-top:20px"></div>
<p>
<div id="bizgenius-citation-widget-container-list" data-maxnum='10' data-show-figure="3" style="width:100%;"></div>
This widget supports the following parameters to make it flexible for your purpose. For example:
data-product-list="RNA++DNA++Protein" // show a dropdown menu listing products, separated by ++


data-product-name="DNA" // default product to be selected in the product dropdown menu

data-classes="- Any Application - ||Neuroscience||Cancer++- Any Species - ||Rat||Mouse||Pig" // show one or more dropdown menus of any predefined terms (e.g. applications). Menus are separated by ++, and terms in each menu are separated by ||

data-place-holder-text="Enter keyword/institute/author/journal/year here" // the placeholder text for the search box

data-allow-user-order="yes" //"yes" or "no", default "yes". Whether to show the "order by" dropdown menu. If this menu is shown, then users can order citation list themselves.

data-filter-impact="yes" //"yes" or "no", default "no". Whether to show the impact factor filter dropdown menu. If this menu is shown, then users can filter citations by impact factor.
The data-classes tag enables you to add customized dropdown menus, which can be useful for users to find relevant citations quickly. Common examples of dropdown menus include applications, fields, technologies, year and country. For the "year" dropdown menu, you may list individual years or year range such as 2012-2025.
Logic operators such as AND, OR, NOT, and quotation marks (for phrase search) are supported. AND can be omitted. The search covers the following fields: title, abstract, title, authors, affiliation, journal, year, snippet, product.
Top Journal List
Top Journal List widget allows you to show a list of top journals which cited your company and products in a conscise way. You will be able to impress your customers with many citations in top journals such as Nature, Science, and Cell, etc.
The above list is generated from this line of code:
<div id="bizgenius-citation-widget-container-list-top" data-maxnum='100' data-minif='20' data-order="impactFactor" style="width:100%;"></div>
This widget supports the following parameters to make it flexible for your purpose. For example:
data-minif="30"

data-product-name="DNA"

data-order="impactFactor" //can also be "publicationDate" or "cited"

data-maxnum="5"

data-paper-link="inpage" //the default site for a paper's abstract and full text information when a user clicks a paper. Default "inpage", can also be "stork", "pubmed" or "journal". "inpage" means the paper detail will be displayed in the popup window in the same page.
data-minif specifies the minimum impact factor to be considered as "top" journal. The default value is 30. When data-product-name is specified, only the citations of that product are shown. data-order takes the following possible values, impactFactor, publicationDate, cited, or id. If empty, the list is ordered by impact factor. data-maxnum specifies the number of citations to show.
New Paper List
The New Paper List widget allows you to enrich your webpage by showing a list of latest papers on a topic or a list of publications authored by your own company (or institute/lab). For example, if you have a product related to CRISPR and Neuroscience, you may enrich the content by adding a section on the product page showing latest research on CRISPR. It helps your potential customers find valuable information and is also helpful to your website's SEO.
van der Zanden, Schipper, van Gelder et al
Cell Death Dis (2026) 17 (1)
Thapa, Oh, Sirkin et al
Stem Cell Reports (2026)
Banerjee, Singh, Gogoi et al
Stem Cell Res (2026) 97, 104115
Kong, Zhang, Li et al
Nat Commun (2026) 17 (1)
The above list is generated from this line of code:
<div id="bizgenius-citation-widget-container-list-new-papers-pubmed" data-theme="box-4" data-maxnum="4" data-keyword="CRISPR[Title] Neuroscience" data-show-abstract="yes" style="width:100%;"></div>
This widget supports the following parameters to make it flexible for your purpose. For example:
data-keyword="CRISPR[title] Neuroscience"

data-keyword='"EEG fMRI"' // if you need to enter keyword as phrase, add double quotation marks

data-keyword=""EEG fMRI"" // or if you need to enter keyword as phrase, use the "

data-maxnum="3"

data-highlightjournal="no" // "yes" or "no", default "yes". Highlight journal based on its reputation

data-show-abstract="yes" //"yes" or "no", default "no". Show abstract or not

data-keyword-highlight="cell,RNA" //keywords to be highlighted in the abstract. Use comma to separate multiple keywords. Only works when data-show-abstract is set to "yes".

data-paging="append" // "append" or "replace", default "append". If "append", new papers will be shown after the previous ones; if "replace", new papers will replace previous ones.

data-paper-link="stork" //the default site for a paper's abstract and full text information when a user clicks a paper. Default "stork", can also be "pubmed" or "journal".
To show a list papers from your own company or institute (lab), you may use [affiliation] tag in the keyword. For example data-keyword="Genentech[affiliation]".
<div id="bizgenius-citation-widget-container-list-new-papers-pubmed" data-maxnum="3" data-keyword="Genentech[Affiliation]" style="width:100%;"></div>
The data source is PubMed. You can also choose to use PubMed Central as the source:
<div id="bizgenius-citation-widget-container-list-new-papers-pmc" data-theme="icon" data-maxnum="3" data-keyword="CRISPR[Title] Neuroscience" data-show-abstract="yes" style="width:100%;"></div>
And the output is:
Yoon, Loi, Zhang et al
Science (2026) 393 (6817), 1230-1235
Mariki, Kohlmeier, Mousavi et al
Regen Med (2025) 20 (11), 653-662
Kong, Zhang, Li et al
Nat Commun (2026) 17 (1)
Wu, Kou, Bai et al
Theranostics (2026) 16 (16), 9384-9415
Citation Number for a Product
Citation Number for a Product allows you to show the total number of citations of a specified product inline. For example, you may have a table listing your products, and you can show the number of citations of each product in the table.
| Products | Citations |
| xjView | |
| RNA | |
| Protein |
The citation counts are generated from codes like this:
<span class="bizgenius-citation-widget-container-count-product" data-product-name="DNA" data-enclose="()"></span>
This widget supports the following parameters to make it flexible for your purpose. For example:
data-product-name="DNA" //product name. If the value is blank, then it will retrieve the total number of citations in the library, regardless of product.

data-product-name="DNA++RNA" //product names. To count the total citation number for multiple products, simply use ++ to separate them.

data-hide-0="yes" //when the number of citations is 0, hide this span element or not. If "yes", hide the number; otherwise display 0. Default value is "no"

data-enclose = "" //what to enclose around the number of citations. For example, the value can be "()", "[]", or simply empty.

data-pretext= "" //text before the citation number. For example "Citations: "

data-posttext = "" //text aftere the citation number. For example " Citation"

data-add-s-for-plural = "s" //Append a string indicating plurality if the number of citations is greater than 1.

data-date-range = "all" //specify the date range. Possible values are all, this_year, last_12_months, last_month. The default value is all.
Top University Carousel
The Top University Carousel widget enhances your webpage by displaying a rotating showcase of prestigious universities whose researchers have cited your products in academic publications.








.svg.png "Korea University")



.png "Lund University")
.svg "Stanford University")




<div class="bizgenius-top-university-widget-container" style="width:100%"></div>
Top Company Carousel
The Top Company Carousel widget enhances your webpage by displaying a rotating showcase of top companies whose researchers have cited your products in academic publications.





















<div class="bizgenius-top-company-widget-container" style="width:100%"></div>
Top University and Company Carousel
The Top University and Company Carousel widget enhances your webpage by displaying a rotating showcase of top universities and companies (mixed) whose researchers have cited your products in academic publications.
<div class="bizgenius-top-university-and-company-widget-container" style="width:100%"></div>
Top Journal Carousel
The Top Journal Carousel widget enhances your webpage by displaying a rotating showcase of prestigious journals where researchers have published papers citing your products.
























<div class="bizgenius-top-journal-widget-container" style="width:100%"></div>
AI Summary
AI Summary shows a short paragraph that AI assistants such as ChatGPT, Claude and Perplexity can quote: how many peer-reviewed publications cite a product (or all of your products), how many countries the citing research comes from, and well-known institutions, companies and journals among the citing papers. It updates itself as new citations come in.
The summary is generated from codes like this:
<div class="bizgenius-citation-widget-container-aisummary" data-product-name="xjview" data-label="xjView"></div>
(You may also use <span>, and several on one page. Leave out data-product-name for all your products.)
This widget supports the following parameters to make it flexible for your purpose. For example:
data-product-name="xjview" //product name, matched the same way as the Citation Number for a Product. Leave it out for a summary of all your products.

data-label="xjView" //the name the paragraph is about. Without it, the product's own name (or "Our products" when there is no product name).

data-hide-0="yes" //when there are no citations, hide this element or not.

data-enclose = "" //what to enclose around the paragraph. For example, the value can be "()", "[]", or simply empty.

data-pretext= "" //text before the paragraph. For example "AI Summary: "

data-posttext = "" //text after the paragraph.
Ask our AI
"Ask our AI" allows you to show an interactive chat box answering user's questions on your citation library. It's like ChatGPT but trained with the publications in your library.
The above chat box is generated from codes like this:
<div id="bizgenius-chatgenius-widget-container" style="width:100%;height:200px;"></div>
This widget supports the following parameters to make it flexible for your purpose. For example:
data-predefined-questions='["What are the applications of xjView?","How did researchers use xjView?"]' // list of predefined questions. Can be empty

data-product-name="SKU321" // limit the citations to the specific product. If not specified, then the entire citation library will be used

max-height:800px // you may specify the max-height of the component in css. If you do not specify max-height, the height will grow as the content grows.
Dual Rendering for AI, Search Engines and People (GEO)
Your citations should reach everyone who looks for your products. More and more scientists ask AI assistants such as ChatGPT, Claude and Perplexity which reagent, kit, instrument or software to use; others search Google or Bing, or browse your website. Most AI crawlers don't run JavaScript: to them, a citation widget that loads in the browser is an empty box.
With dual rendering, your citations are delivered twice. Your web server gets them from our API while it builds the page and puts them straight into the HTML, so AI crawlers and search engines read the same citations your visitors see. Then the widget takes over in the browser, so visitors keep search, filters and paging. This is what Generative Engine Optimization (GEO), also called Answer Engine Optimization (AEO), is about: making the evidence for your products easy for AI to find, quote and link to.
What goes into your page’s HTML
Contact us for the API documentation.