
Citation Search Form
This is an example showing how Citaton Search Form works together with Citation List.
Regional brain volume abnormalities in Lesch-Nyhan disease and its variants: a cross-sectional study
Schretlen, Varvaris, Ho et al
Lancet Neurol (2013) 12 (12), 1151-8 DOI: 10.1016/s1474-4422(13)70238-2

Schretlen, Varvaris, Ho et al
Lancet Neurol (2013) 12 (12), 1151-8 DOI: 10.1016/s1474-4422(13)70238-2
Cited by 45
AI Summary: In this study, the xjView product (version 8.11) was used to generate visualizations of brain regions with significant grey matter volume differences between groups, aiding in the identification and presentation of regional brain abnormalities associated with Lesch-Nyhan disease and its variants.
Snippet: of each cluster that remained significant after family-wise correction in the three-group ANCOVA were created with the xjView (version 8.11 Red areas are regions in which healthy controls had a greater grey matter volume than did patients with classic Lesch-Nyhan disease;of p LND;blue HC > LNV;green LNV > LND) (Neurological Convention, p;... …
Multidimensional effects of personalized exercise intervention in type 2 diabetes: a randomized controlled trial
Liu, Cheng, Wang et al
Sci Bull (Beijing) (2026)
Liu, Cheng, Wang et al
Sci Bull (Beijing) (2026)
AI Summary: In this study, xjView was used to visualize statistical maps of brain activation and connectivity, helping to illustrate the effects of personalized exercise on neural function in adults with type 2 diabetes.
Snippet: ns in psychophysiological interaction analyses to quantify task-dependent functional connectivity changes (post-pre). Activation and connectivity metrics were subsequently entered into correlation and mediation analyses with metabolic and cognitive outcomes. Statistical maps were visualized using xjView
Addressing artifactual bias in large, automated MRI analyses of brain development
Elyounssi, Kunitoki, Clauss et al
Nat Neurosci (2025) 28 (8), 1787-1796 DOI: 10.1038/s41593-025-01990-7


Elyounssi, Kunitoki, Clauss et al
Nat Neurosci (2025) 28 (8), 1787-1796 DOI: 10.1038/s41593-025-01990-7
Cited by 16
AI Summary: The paper used the xjView software to visually display regions of MRI signal dropout on structural brain images, aiding in the identification and illustration of areas affected by image artifacts.
Snippet: and were thresholded by a whole brain mask in MarsBar. Areas of dropout were thresholded at n>10 subjects with dropout in that region and drop-out was displayed on an exemplar structural image in xjView (https://www.alivelearn.net/xjview)
Blood-brain barrier disruption and sustained systemic inflammation in individuals with long COVID-associated cognitive impairment
Greene, Connolly, Brennan et al
Nat. Neurosci. (2024) 27 (3), 421-432 DOI: 10.1038/s41593-024-01576-9
Greene, Connolly, Brennan et al
Nat. Neurosci. (2024) 27 (3), 421-432 DOI: 10.1038/s41593-024-01576-9
Cited by 422
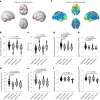
AI Summary: The xjView software was used in this study to generate volumetric brain maps for comparing COVID+ and COVID− groups, facilitating visualization and analysis of brain imaging data. Its application enabled researchers to effectively interpret and present neuroimaging results, contributing to the identification of blood-brain barrier disruption in long COVID patients with cognitive impairment.
Snippet: … All scans were performed on the same Philips 3T system at Hammersmith Hospital. Volumetric maps for comparisons between COVID+ and COVID− groups were generated in xjView after automatic brain segmentation in the CAT12 toolbox with default parameters and subsequent smoothing with an 8-mm kernel. …
The brain adapts to dishonesty
Garrett, Lazzaro, Ariely et al
Nat. Neurosci. (2016) 19 (12), 1727-1732 DOI: 10.1038/nn.4426
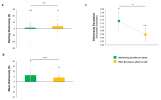
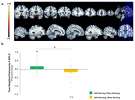
Garrett, Lazzaro, Ariely et al
Nat. Neurosci. (2016) 19 (12), 1727-1732 DOI: 10.1038/nn.4426
Cited by 180
AI Summary: In this paper, the authors used xjView to threshold and visualize meta-analytic fMRI maps from Neurosynth, helping to define regions of interest related to emotion processing in their investigation of how the brain adapts to dishonesty.
Snippet: using an AR(1) process. fMRI analysis ROI: Our ROI was defined by generating a map in Neurosynth, a meta-analysis based on 11,406 studies, reflecting P(Emotion|Activation) thresholded at z = 5 using xjView (note that the results are robust and observed for maps generated using different thresholds). This map corresponds to the likelihood that the term “emotion” is used in a study given the pr
Population coding of affect across stimuli, modalities and individuals
Chikazoe, Lee, Kriegeskorte et al
Nat. Neurosci. (2014) 17 (8), 1114-22 DOI: 10.1038/nn.3749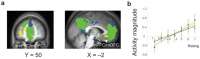
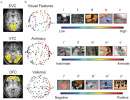
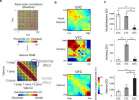
Chikazoe, Lee, Kriegeskorte et al
Nat. Neurosci. (2014) 17 (8), 1114-22 DOI: 10.1038/nn.3749
Cited by 336
AI Summary: The xjview8 software from xjview was used to visualize brain imaging results, aiding in the interpretation of neural codes for affect across stimuli, modalities, and individuals in this study.
Snippet: To visualize the results, xjview software (http://www.alivelearn.net/xjview8) was used. Representational similarity analysis For each participant, a vector was created containing the spatial pattern of BOLD-MRI signal related;tion regressors were included to regress out motion-related effects. For each voxel, t-values of individual trials were demeaned by subtracting the mean value across trials
The effects of neural gain on attention and learning
Eldar, Cohen, Niv
Nat. Neurosci. (2013) 16 (8), 1146-53 DOI: 10.1038/nn.3428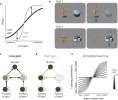
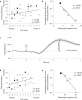
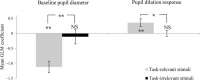
Eldar, Cohen, Niv
Nat. Neurosci. (2013) 16 (8), 1146-53 DOI: 10.1038/nn.3428
Cited by 438
AI Summary: The xjView8 software from xjview was used to provide MNI coordinates for the cerebrum and frontal lobe, enabling the researchers to restrict their analysis to grey matter within these brain regions.
Snippet: Mean Gray-matter, white-matter and CSF fMRI signals and movement parameters were regressed out of functional data. Cerebrum and frontal lobe MNI coordinates provided with xjView (http://www.alivelearn.net/xjview8/) were used to restrict analysis to grey matter within these areas
Smokers' brains compute, but ignore, a fictive error signal in a sequential investment task
Chiu, Lohrenz, Montague
Nat. Neurosci. (2008) 11 (4), 514-20 DOI: 10.1038/nn2067
Chiu, Lohrenz, Montague
Nat. Neurosci. (2008) 11 (4), 514-20 DOI: 10.1038/nn2067
Cited by 148
AI Summary: In this paper, the authors used xjView (specifically, the xjView toolbox for SPM) to visualize and interpret brain activation maps derived from fMRI data, aiding in the identification of neural correlates of fictive and experiential error signals in smokers and nonsmokers.
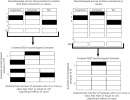
Snippet: experience. A learner starts in the state S t (represented by the center dark circle), takes the action a t , receives reward r t and transitions to state S t+1 (represented by the top red circle). This is the learner's actual experience
Race modifies default mode connectivity in Alzheimer's disease
Misiura, Howell, Wu et al
Transl Neurodegener (2020) 9, 8 DOI: 10.1186/s40035-020-0186-4

Misiura, Howell, Wu et al
Transl Neurodegener (2020) 9, 8 DOI: 10.1186/s40035-020-0186-4
Cited by 29
AI Summary: The xjView toolbox was used in this study to manually confirm that the identified brain imaging components accurately contained only the regions of interest within the default mode network subsystems. By enabling precise anatomical verification, xjView contributed to the reliability of the study’s neuroimaging analyses examining race-related differences in Alzheimer’s disease biomarkers.
Snippet: rk subdivisions and coordinates outlined by Andrews-Hanna [36], we identified 11 components that contained our regions of interest for the DMN subsystems. Components were manually confirmed using the xjview toolbox (http://www.alivelearn.net/xjview/) to ensure that they contained only our regions of interest. Regions included the temporal pole (TP), lateral temporal cortex (2 regions;ventrolatera
Learning of distant state predictions by the orbitofrontal cortex in humans
Elliott Wimmer, Büchel
Nat Commun (2019) 10 (1), 2554 DOI: 10.1038/s41467-019-10597-z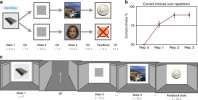
Elliott Wimmer, Büchel
Nat Commun (2019) 10 (1), 2554 DOI: 10.1038/s41467-019-10597-z
Cited by 63
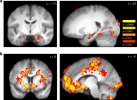
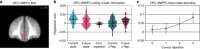
AI Summary: The authors used xjView, a neuroimaging visualization tool, to display and interpret fMRI activation patterns associated with predictive representations in the orbitofrontal cortex. xjView facilitated the clear presentation and anatomical localization of brain regions involved in learning distant state predictions, supporting the study’s conclusions about neural mechanisms of planning and decision making.
Showing 1-10 of 2344 papers.
Powered by BizGenius